Introduction
Network address translation (NAT) is used to enable instances in a private subnet to connect to the internet or other AWS services, but prevent the internet from initiating a connection with those instances.
To implement a NAT in an AWS/VPC environment you can choose between a NAT instance which is an EC2 instance placed in the public subnet or NAT Gateway a Managed Service by AWS.
Choosing the right solution depends on several factors, like availability, maintenance, or cost. You can refer to a detailed comparison here.
In this article, we will focus on the NAT Gateway, the associated pricing model, and real-life project monitoring and analysis.
In some cases, you can be faced with an unexpectedly high bill for NAT Gateway! and you don’t have any idea how to troubleshoot the source of the hidden cost.
To reduce the cost of AWS NAT Gateway, we will show you by example how to monitor and analyze NAT Gateway logs to detect the source of the unexpected cost and traffic.
Pricing model by example
The NAT Gateway pricing model differs between regions and based on 3 factors:
- NAT Gateway Hourly Charge: NAT Gateway is charged on an hourly basis
- NAT Gateway Data Processing Charge: applied for each Gigabyte processed through the NAT gateway regardless of the traffic’s source or destination.
- Data Transfer Charge: Applied for all data transferred via the NAT gateway between regions, between availability zones, or to the internet.
Example 1
Let’s assume you created an EC2 instance in a private subnet behind a NAT Gateway and both are in the same availability zone. Your EC2 instance sends 100 files of 1GB to one of your buckets in the same region every day.
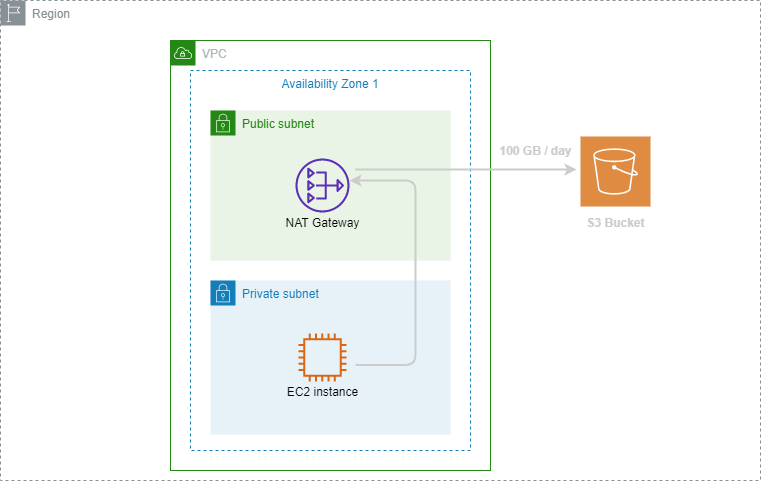
As NAT Gateway pricing differs between regions, we will take a position in Paris region to calculate monthly charge:
- NAT Gateway Hourly Charge: The rate is $0.05 per hour / $36 per month.
- NAT Gateway Data Processing Charge: The rate is $0.05 per GB Processed. In our example, 1 GB of data went through the NAT gateway. Which will result in a monthly charge of $0.05 * 100 * 30 = $150
- Data Transfer Charge: No charge for the data transfer between the NAT Gateway and the EC2 instance since the traffic stays in the same availability zone using private IP addresses. And there was no charge for the data transfer from the EC2 instance to S3 as it is Data Transfer Out to Amazon EC2 to S3 in the same region.
In summary, your monthly charge will be $186:
- $150 for 300 GB data processed by the NAT gateway
- $36 will always apply once the NAT gateway is provisioned and available.
The data transfer has no charge in this example. However, if you send the file to a non-AWS internet location instead, there will be a data transfer charge as it is data transfer out from Amazon EC2 to the internet.
Finally, you can avoid the NAT Gateway Data Processing charge in this example by setting up a Gateway Type VPC endpoint and route the traffic to/from S3 through the VPC endpoint instead of going through the NAT Gateway.
Taking this action will reduce the monthly charge by 80% in our example as there is no data processing or hourly charges for using Gateway Type VPC endpoints.
Exemple 2
Let’s assume you have a fleet of EC2 instances in a private subnet behind a NAT Gateway and the NAT gateway and EC2 instances are NOT in the same availability zone. Your EC2 instances send 500 GB of data to an external server (non-AWS resources) every day.
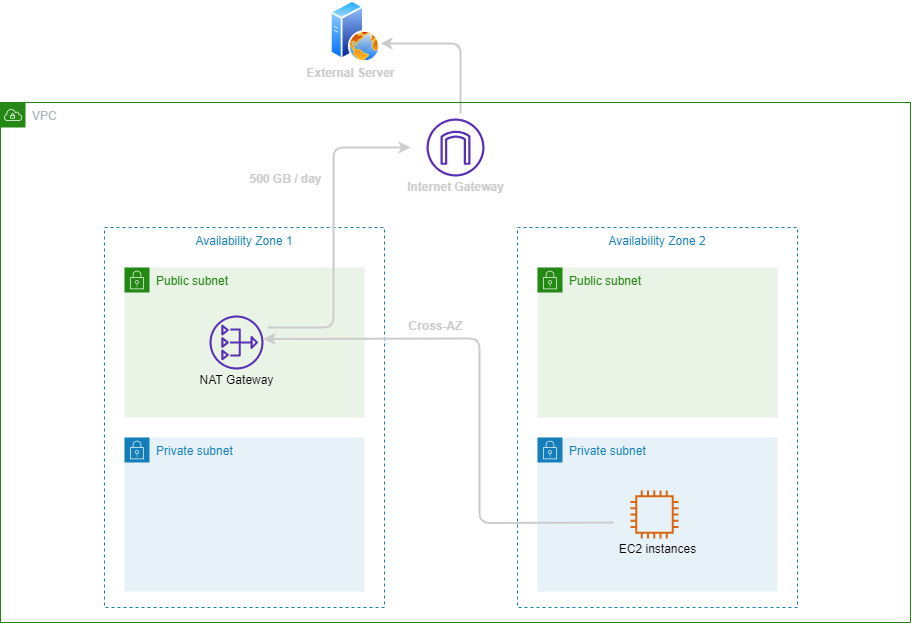
We will take a position again in Paris region to calculate monthly charge:
- NAT Gateway Hourly Charge: The rate is $0.05 per hour / $36 per month.
- NAT Gateway Data Processing Charge: The rate is $0.05 per GB Processed. In our example, 1 GB of data went through the NAT gateway. Which will result in a monthly charge of $0.05 * 500 * 30 = $750
- Data Transfer Charge (refer to AWS Data Transfer pricing):
- The traffic is cross-AZ between the NAT Gateway and the instance occurs charge, which will result in a monthly charge of $0.01 per GB * 500 * 30 = $150
- The data transferred OUT From NAT Gateway To Internet occurs a monthly charge of $0.09 * 500 * 30 = $1350
In summary, your monthly charge in this example will be easily $2286.
In this example, you see that your NAT Gateway bill can easily increase if you are not aware of the different aspects of charges, especially the data transferred OUT From NAT Gateway To Internet charges.
You can avoid the cross-AZ charge by putting the NAT Gateway and EC2 instances in the same Availability zone.
If most of your internet traffic is destined to non-AWS resources, you can avoid NAT Gateway Data Processing Charge by using an internet gateway for EC2 instances generating the highest traffic.
Internet gateways give your instances direct internet access at no cost in condition to configure Security groups and network access control lists to prevent unauthorized access to instances, depending on your security policies.
For connectivity through internet gateways, instances must be in a public subnet and have a public IP or Elastic IP address associated with its network interface.
By taking these 2 actions, you will reduce the monthly charge by 40% approximately in our example as there are fewer data processed by NAT Gateway and no cross-AZ traffic between EC2 instances and NAT Gateway.
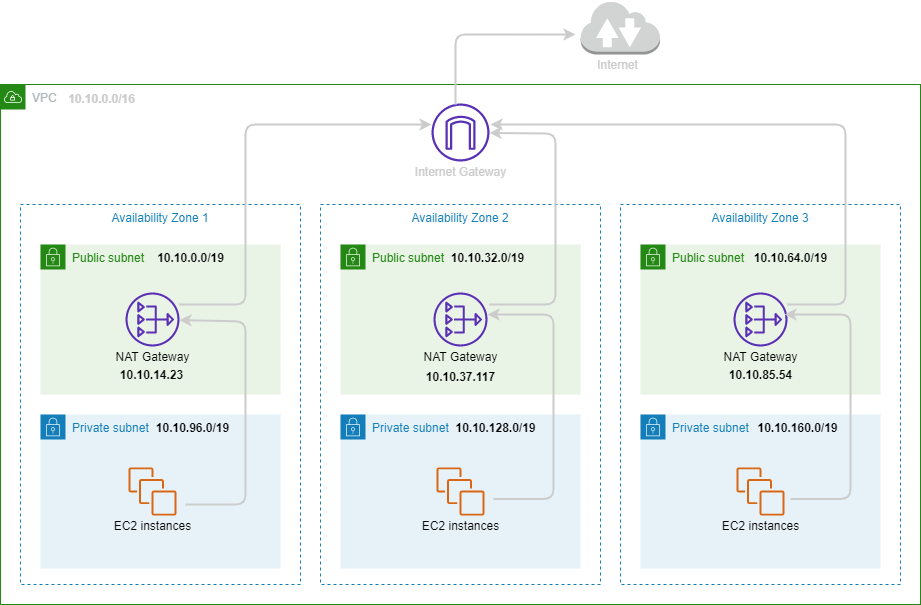
Architecture
For the next topics of this article, we will be based on the architecture below, the idea is to be closer to most AWS production environments.
We have chosen a VPC with 6 subnets spread over three Availability zones with the following IP ranges:
| Availability Zone | Subnet | Private / Public | CIDR |
|---|---|---|---|
| 1 | Subnet 1 | Public | 10.10.0.0/19 |
| 1 | Subnet 2 | Private | 10.10.96.0/19 |
| 2 | Subnet 3 | Public | 10.10.32.0/19 |
| 2 | Subnet 4 | Private | 10.10.128.0/19 |
| 3 | Subnet 5 | Public | 10.10.64.0/19 |
| 3 | Subnet 6 | Private | 10.10.160.0/19 |
Monitoring via CloudWatch (Metrics)
Like most services in AWS, You can monitor your NAT gateway using CloudWatch, which collects information from your NAT gateway and creates readable, near real-time metrics.
You can use this information to monitor and troubleshoot your NAT gateway.
In this chapter, we will introduce the metrics which are in relation to processed and transferred data to troubleshoot the traffic going to the internet. You can see the detailed list of NAT Gateway metrics here.
The main metrics which describe the data processed by NAT Gateway are:
- BytesInFromSource: The number of bytes received by the NAT gateway from clients in your VPC.
- BytesOutToDestination: The number of bytes sent out through the NAT gateway to the destination.
- BytesInFromDestination: The number of bytes received by the NAT gateway from the destination.
- BytesOutToSource: The number of bytes sent through the NAT gateway to the clients in your VPC.
In the following schema, we will illustrate the link between the traffic and there 4 golden metrics:
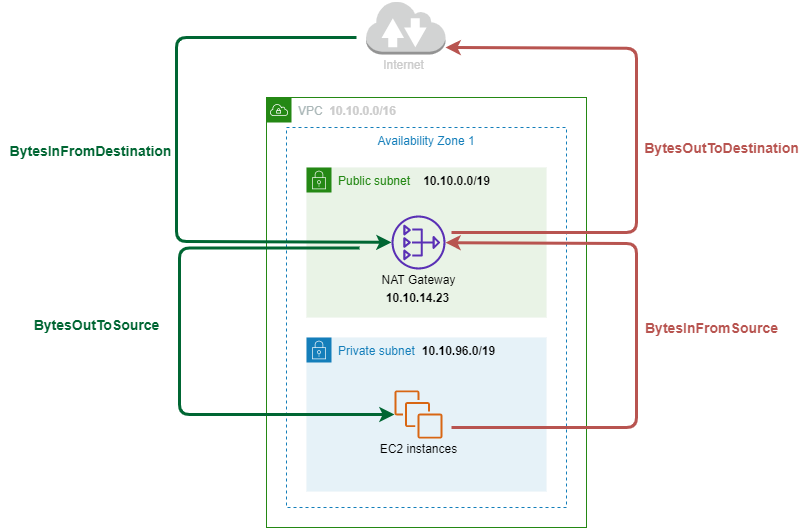
A value greater than zero for BytesOutToDestination and BytesOutToSource indicates that there is traffic going to/coming from the internet from clients that are behind the NAT gateway.
If the value for BytesOutToDestination is less than the value for BytesInFromSource or the value for BytesOutToSource is less than the value for BytesInFromDestination, there may be data loss during NAT gateway processing, or traffic being actively blocked by the NAT gateway.
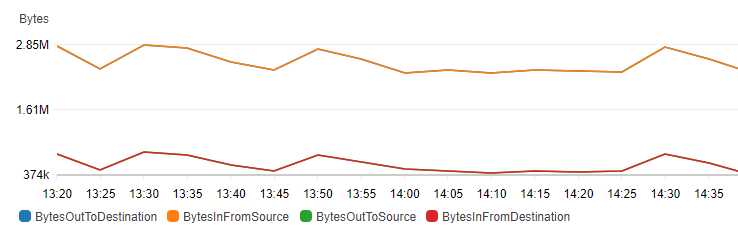
In normal behavior, we should have:
- BytesInFromSource = BytesOutToDestination
- BytesInFromDestination = BytesOutToSource
If you take a look at the CloudWatch dashboard below, you can see that the normal behaviour formula is confirmed.
When you have such beautiful metrics, you can create CloudWatch Alarm which watches for every metric over a time period that you specify.
For example, you can create an alarm that monitors the amount of traffic coming in or leaving the NAT gateway. The alarm monitors the amount of outbound traffic from clients in your VPC through the NAT gateway to the internet.
For instance, The alarm cad sends a notification when the number of bytes reaches a threshold of 5,000,000 during a 15-minute period.
NAT Gateway Logs Analysis with Amazon Athena.
The logs of NAT Gateway are included in the VPC flow logs. The VPC flow logs enable you to capture information about the IP traffic going to and from network interfaces in your VPC.
The Flow log data can be published to Amazon CloudWatch Logs or Amazon S3. For our case, we will deep dive into analyzing NAT Gateway logs in Amazon S3 as a destination using Amazon Athena.
To understand how to create a VPC flow logs table in Athena, you can refer to AWS’s official documentation here.
Amazon Athena is a magic query service that makes it easy to analyze data in Amazon S3 using standard SQL.
Questions ❓
If we come to our main use case described in the Architecture Topic, the exercise is
- How to detect the top outgoing traffic (From EC2 to the internet) by source/destination? which include Data Processing Charge and Data Transfer Charge.
- How to detect the top coming traffic (From the internet to EC2) by destination/source?, which include only Data Processing Charge because Data Transfer Charge is free.
Before answering the 2 questions, you need to have an idea about the fields of the VPC flow logs, you can find a description of every field here. In our SQL queries we will focus on the following log fields/columns:
- srcaddr / sourceaddress: The source address for incoming traffic, or the IPv4 or IPv6 address of the network interface for outgoing traffic on the network interface.
- dstaddr / destinationaddress: The destination address for outgoing traffic, or the IPv4 or IPv6 address of the network interface for incoming traffic on the network interface.
- bytes / numbytes: The number of bytes transferred during the flow.
- packets / numbytes: The number of packets transferred during the flow.
- start / starttime: The time, in Unix seconds, when the first packet of the flow was received within the aggregation interval.
- end / endtime: The time, in Unix seconds, when the last packet of the flow was received within the aggregation interval.
Responses 💡
For the first question, we should identify the traffic from EC2 instances to Internet Passing by NAT Gateway. As we suppose you have created the VPC flow logs table with the proper partitions on the date field, you can execute the following SQL query:
Note: Before running the query, you need to modify
– The values of the three elastic network interfaces eni-{natgateway1}, eni-{natgateway2} and eni-{natgateway3}
– The IP addresses of the three NAT Gateway, IPs in our example are 10.10.14.23′, ‘10.10.37.117’, and ‘10.10.85.54’.
– The Date range.
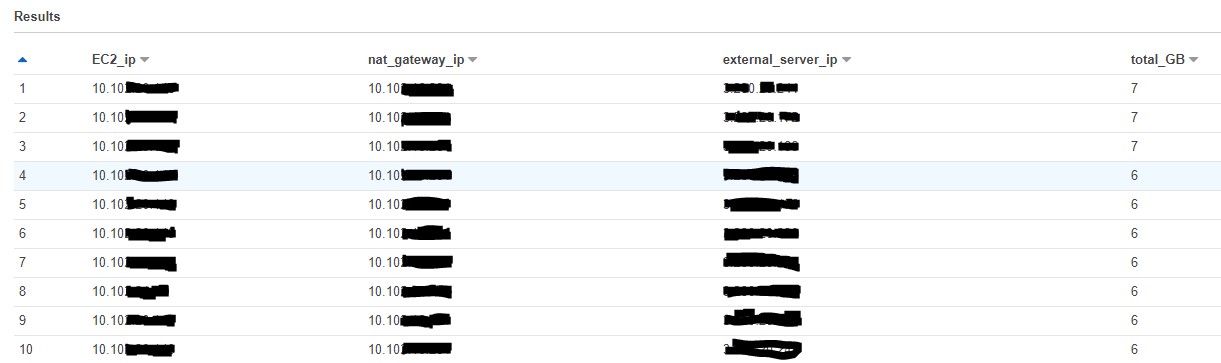
| SELECT s.sourceaddress as EC2_ip,s.destinationaddress as nat_gateway_ip, d.destinationaddress as external_server_ip, sum(s.numbytes)/1000000000 as total_GB from (SELECT sourceaddress,destinationaddress, numpackets,numbytes,starttime,endtime FROM “default”.”vpc_flow_logs” where (interfaceid =’eni-{natgateway1}’ or interfaceid =’eni-{natgateway2}’ or interfaceid =’eni-{natgateway3}’) and date between DATE(‘2020-10-10’) and DATE(‘2020-10-11’) and destinationaddress in (‘10.10.14.23’, ‘10.10.37.117’, ‘10.10.85.54’) and sourceaddress like ‘10.10.%’) s, (SELECT sourceaddress,destinationaddress, numpackets,numbytes,starttime,endtime FROM “default”.”vpc_flow_logs” where (interfaceid =’eni-{natgateway1}’ or interfaceid =’eni-{natgateway2}’ or interfaceid =’eni-{natgateway3}’) and date between DATE(‘2020-10-10’) and DATE(‘2020-10-11’) and sourceaddress in (‘10.10.14.23’, ‘10.10.37.117’, ‘10.10.85.54’) and destinationaddress not like ‘10.10.%’) d where s.destinationaddress = d.sourceaddress and d.numpackets=s.numpackets and d.numbytes = s.numbytes and d.starttime = s.starttime and d.endtime = s.endtime group by s.sourceaddress,s.destinationaddress, d.destinationaddressorder by total_GB desc limit 10; |
This SQL query returns the top 10 outgoing traffic From EC2/source to the internet/destination. By executing this query in a random AWS environment we can see the concerned EC2 to troubleshoot.
For the second question which concerns the top coming traffic From the internet to EC2, it will be the same logic with a small modification in SQL Query:
| SELECT s.sourceaddress as external_server_ip,s.destinationaddress as nat_gateway_ip, d.destinationaddress as EC2_ip, sum(s.numbytes)/1000000000 as total_GB from (SELECT sourceaddress,destinationaddress, numpackets,numbytes,starttime,endtime FROM “default”.”vpc_flow_logs” where (interfaceid =’eni-{natgateway1}’ or interfaceid =’eni-{natgateway2}’ or interfaceid =’eni-{natgateway3}’) and date between DATE(‘2020-10-10’) and DATE(‘2020-10-11’) and destinationaddress in (‘10.10.14.23’, ‘10.10.37.117’, ‘10.10.85.54’) and sourceaddress not like ‘10.10.%’) s, (SELECT sourceaddress,destinationaddress, numpackets,numbytes,starttime,endtime FROM “default”.”vpc_flow_logs” where (interfaceid =’eni-{natgateway1}’ or interfaceid =’eni-{natgateway2}’ or interfaceid =’eni-{natgateway3}’) and date between DATE(‘2020-10-10’) and DATE(‘2020-10-11’) and sourceaddress in (‘10.10.14.23’, ‘10.10.37.117’, ‘10.10.85.54’) and destinationaddress like ‘10.10.%’) d where s.destinationaddress = d.sourceaddress and d.numpackets=s.numpackets and d.numbytes = s.numbytes and d.starttime = s.starttime and d.endtime = s.endtime group by s.sourceaddress,s.destinationaddress, d.destinationaddress order by total_GB desc limit 10; |
You can play with the SQL query to get the top traffic by EC2 or by the external server for instance.
After getting results in Athena, you can make a CSV export, so you can add a cost column and apply the formula we have detailed at the beginning of the article.
Conclusion
Analyzing NAT Gateway logs and metrics is an efficient way to track the amount of traffic processed and keep you updated about the hidden costs behind the NAT Gateway bill.
In this article, I tried to go deeper into querying logs because I have worked with many customers who asked why NAT Gateway is too expensive and why the bill is more expensive each month. And the only answer is deep-diving into logs to detect the machines behind the traffic.
Feel free to contact me if you have any questions 🙂